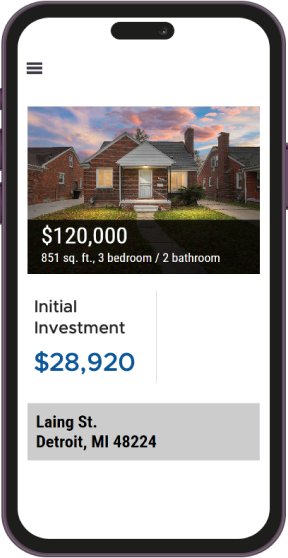
Short Term Rentals
Welcome to Invest.net, where your journey into the profitable world of short-term rentals begins. Imagine owning a portfolio that brings in steady, passive income. That’s what we’re all about here. At Invest.net, it’s more than just managing assets. It’s creating an experience that’s profitable and hassle-free for our partners. Let’s make those investment opportunities work hard!

Why Invest in Short Term Rentals?
Short-term rentals offer a compelling investment opportunity. They offer solid financial returns and give owners flexibility in management. With travel on the rise, more people prefer staying at short-term rentals over hotels. This brings a variety of guests and high-income potential. So, why are savvy investors flocking to this market?
High Return on Investment
- Premium Pricing: Short-term rentals can make more money each day compared to long-term leases. This means a nice bump in income potential.
- Increased Occupancy Rates: Clever marketing and prime property spots can fill up those vacancies. More tenants mean steady income throughout the year.
Market Growth and Resilience
- Expanding Market: Platforms like Airbnb and VRBO have flipped the rental market on its head. Finding renters is a breeze now, and staying visible is very easy.
- Recession Resilience: Even when the economy isn't doing great, people still need short-term rentals. This is especially true in popular tourist spots.
Enhanced Flexibility
- Adaptive Use: Investors can change how they use their properties based on the season, local events, or market trends. This helps them keep earning from their assets.
- Personal Use: Short-term rentals aren't like the usual ones. Owners get to use them for their own vacations, too. It's a win-win: save some cash and have personal retreats!
Scalability
- Portfolio Diversification: Short-term rentals can really shake things up in a real estate portfolio. They spread out the risk and let investors explore different markets.
- Ease of Expansion: Short-term rentals are pretty adaptable. They can grow or downsize based on investor needs and market trends.
Community and Economic Contributions
- Supporting Local Economies: Short-term rentals give a nice lift to local economies. Visitors often spend cash on food, shopping, and fun activities in the area.
- Creating Employment: Looking after these properties means more jobs. It's not just about managing the buildings; it also gives a lift to local tourism services.
Invest.net's Approach to Short Term Rentals
At Invest.net, our approach to short-term rentals is informed by our extensive background as owners and operators in the private equity and real estate sectors. This gives us a serious advantage. We use what we know to make sure every rental investment performs at its best for partners. So, why choose us? Here’s how our unique approach makes all the difference:
Owner's Mindset
- Long-Term Commitment: We see each investment as a long-term journey. Our goal is to achieve steady growth and consistent profits over the years.
- Hands-On Management: We handle every property like it's ours. This means diving into daily management and making important decisions. Our goal is to always perform well and satisfy clients.
Proprietary Procurement
- Access to Exclusive Properties: We have a unique investor network. It lets us grab prime real estate ideal for short-term rentals. These properties are usually beyond the reach of most buyers in the market.
- Strategic Asset Selection: We handpick properties with great care. Location matters a lot to us, as does the potential for high occupancy rates and solid returns on investment. Each property must meet our strict standards for success before we consider it.
Deal Financing and Structuring
- Customized Financing Solutions: Coming from a solid investment banking background, we offer financing tailored for short-term rental investments.
- Smooth Transactions: We ensure every deal runs smoothly for both buyers and sellers. Our aim is to reduce risks and increase profits.
Full-Spectrum Asset Management
- End-to-End Management Services: Our team handles it all for short-term rentals. We buy and fix up properties, market them, and take care of daily operations.
- Technology Integration: We use cutting-edge technology to simplify booking, set smart prices, and stay connected with guests. This makes everything run smoothly and keeps everyone satisfied.
Legal and Regulatory Compliance
- Expert Legal Support: Our legal team takes care of all the contracts and agreements. They ensure everything is detailed and complies with local laws. This protects our investors and their assets.
- Due Diligence: We dive into each property. We look at its legal status, market potential, and operational efficiency. This helps us make smart investment decisions.
Services and Solutions
At Invest.net, everything needed to make short-term rental investments thrive is covered. Our focus is boosting performance across the board. From buying properties and securing financing to smooth operations and happy guests—it’s all handled here. Support for investors every step of the way: that’s what it’s about.
Acquisition and Setup
- Market Analysis: We use cutting-edge analytics to find promising markets and properties. These match up with the latest trends and what investors want.
- Property Acquisition: We find properties through our unique network. This helps us score top-notch places at awesome prices.
- Renovation and Furnishing: Our team takes care of all the renovations and decor setups. We ensure the property looks fantastic and functions perfectly for short-term rental guests.
Financing and Legal Services
- Tailored Financing Options: We provide custom financing solutions. Need to expand a current portfolio or make that first investment move? We've got it all sorted for you.
- Legal and Regulatory Compliance: Our legal team keeps us on the right side of local and national laws. This ensures investments stay protected from any potential legal troubles.
Operational Management
- Property Management: We take care of it all—repairs, cleaning, and guest services. Our team ensures every property runs like clockwork so guests have an unforgettable stay.
- Dynamic Pricing Strategy: We tweak prices on the spot using real-time market data. This way, more rooms get booked and revenue goes up.
Marketing and Customer Relations
- Multi-Channel Marketing: Our marketing team pulls out all the stops to promote properties. They tap into digital marketing, social media, and even traditional ads. This ensures that these properties get seen everywhere!
- Customer Engagement and Support: Our customer support team is here 24/7. This keeps guests happy and makes sure all questions and bookings go smoothly. The result is more repeat business and awesome reviews!
Technology and Innovation
- Advanced Booking Systems: Our awesome booking systems make it simple for guests to find great deals and help owners earn more.
- Performance Monitoring: Regularly checking property performance with detailed reports helps in making smart decisions and adjusting investment plans.
Are you looking to boost that investment portfolio with some prime short-term rentals? Invest.net is on it. We help find the best properties and make them profitable. Reach out today for a consultation. Our team is ready to talk about those investment goals. Have questions? We’ve got answers and can dive deep into the potential of short-term rentals.

